Siehe den vorherigen Beitrag hier .
Testen statistischer Hypothesen
Für Statistiker und Datenwissenschaftler ist das Testen einer statistischen Hypothese ein formales Verfahren. Der Standardansatz zum Testen einer statistischen Hypothese besteht darin, das Untersuchungsgebiet zu definieren, zu entscheiden, welche Variablen zur Messung des Themas benötigt werden, und dann zwei konkurrierende Hypothesen vorzuschlagen. Um zu vermeiden, dass nur die Daten berücksichtigt werden, die unsere subjektiven Bewertungen stützen, geben die Forscher ihre Hypothese im Voraus klar an. Basierend auf den Daten wenden sie dann Stichprobenstatistiken an, um diese Hypothese zu bestätigen oder abzulehnen.
Das Testen statistischer Hypothesen beinhaltet die Verwendung von Teststatistiken, d.h. Probenwert als Funktion der Beobachtungsergebnisse. Eine Teststatistik ist ein Wert, der aus Probendaten berechnet wird, um die Stärke von Daten zu bewerten, die eine statistische Nullhypothese bestätigen, und um ein Maß für die Diskrepanz zwischen empirischen und hypothetischen Werten zu identifizieren. Spezifische Testmethoden werden als Tests bezeichnet, z. B. Z-Test, T-Test (bzw. Fisher-Z-Test, Student-T-Test) usw. abhängig von den darin verwendeten Teststatistiken.
Hinweis . In der heimischen statistischen Wissenschaft wird der "vage" Begriff "Kriterienstatistik" verwendet. Nebelig, weil wir hier wieder eine weiche Substitution beobachten: Anstelle eines Tests entsteht ein Kriterium. Ein Kriterium ist im Übrigen ein Prinzip oder eine Regel. Wenn wir beispielsweise Z-Test, T-Test usw. durchführen, verwenden wir entsprechend Z-Statistik, T-Statistik usw. in der Regel zur Ablehnung der Hypothese. Dies wird in der folgenden Tabelle gut zusammengefasst:
Testen der Hypothese |
Teststatistik |
Ablehnungsregel für Hypothesen |
Z-Tests |
Z-Statistik |
Wenn die Teststatistik ≥ z oder ≤ -z ist, lehnen Sie die Nullhypothese H 0 ab . |
T-Tests |
t-Statistik |
Wenn die Teststatistik ≥ t oder ≤ -t ist, lehnen Sie die Nullhypothese H 0 ab . |
Varianzanalyse (ANOVA) |
F-Statistik |
≥ F, H0. |
- |
- |
≥ χ, H0. |
, -, - . , , -.
, « - »? . , . , , . , , . H0.
, , , , . « » , , -, , , .
, H1. , . , , . , - , :
H0: - -
H1: - -
, - -. «» (.. ), , , . (.. , ), .
, , .
, . , , , .
, :
,
,
, 1- 2- :
|
H0 |
H0 |
H0 |
|
1- ( ) |
H0 |
2- ( ) |
|
1- , 2- . , , , , . , , .
. 5% 1%. 5% , 1% — . α () . , ( -, ), , . , , . 5%, .
-
- AcmeContent , -, . , , - .
, , AcmeContent - . - , 5% -. . . , , "0", ( , ) , "1".
z-
, .
z- . , -, , , .
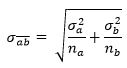
, . Z- , .. (), . , , , :

σ2a — a, σ2b — b na nb — a b. Python :
def pooled_standard_error(a, b, unbias=False):
''' '''
std1 = a.std(ddof=0) if unbias==False else a.std()
std2 = b.std(ddof=0) if unbias==False else b.std()
x = std1 ** 2 / a.count()
y = std2 ** 2 / b.count()
return sp.sqrt(x + y)
, , . z:

pooled_standard_error
, , z- :
def z_stat(a, b, unbias=False):
return (a.mean() - b.mean()) / pooled_standard_error(a, b, unbias)
z , , . , z- , . , , z- :
def z_test(a, b):
return stats.norm.cdf([ z_stat(a, b) ])
z- -. -, , - . groupby('site')['dwell-time']
. get_group
, -:
def ex_2_14():
'''
- z-'''
groups = load_data('new-site.tsv').groupby('site')['dwell-time']
a = groups.get_group(0)
b = groups.get_group(1)
print('a n: ', a.count())
print('b n: ', b.count())
print('z-:', z_stat(a, b))
print('p-: ', z_test(a, b))
a n: 284
b n: 16
z-: -1.6467438180091214
p-: [0.04980536]
5% 95%. , , 95%- . , , 5%- .
P- — 1- , . p-, , , .
0.0498, 4.98%. 5% , , .
:
H0: - -
H1: - -.
, - .
, - -, — , , . , - 16 . , .
, , .
t-
t- , , , .
1908 , , , . «».
— , t- , . , t- , 1. , , .

, t- . .
, df . degrees of freedom, . , .
, , , 10 8, , , 12. , , , , .
, , , 10, 10, . , 10, 10, , , .
: , . : .
, .
t-
t- t-. z-, . t- t- :

Sa̅b̅ — . , :
σa σb, . t- ().
, t- :

. , t- . :
def pooled_standard_error_t(a, b):
''' t-'''
return sp.sqrt(standard_error(a) ** 2 +
standard_error(b) ** 2)
t- z- -, :
t_stat = z_stat
def ex_2_15():
''' t-
-'''
groups = load_data('new-site.tsv').groupby('site')['dwell-time']
a = groups.get_group(0)
b = groups.get_group(1)
return t_stat(a, b)
-1.6467438180091214
, — z- , .
t-
t- , p-. t-, t-, :
def t_test(a, b):
df = len(a) + len(b) - 2
return stats.t.sf([ abs(t_stat(a, b)) ], df)
, 298.

, . :
H0:
H1:
:
def ex_2_16():
'''
- t-'''
groups = load_data('new-site.tsv').groupby('site')['dwell-time']
a = groups.get_group(0)
b = groups.get_group(1)
return t_test(a, b)
array([ 0.05033241])
p-, 0.05. α, 5%, , . t- . , z- .
, - . , .
, , , , . «» , α . , , , , .
— . , .
, 1- . , - . α , -.

stats scipy t-. stats.ttest_ind
. - . equal_var
True
, , , ( t_test_verbose
, ( ):
def ex_2_17():
''' t-'''
groups = load_data('new-site.tsv').groupby('site')['dwell-time']
a = groups.get_group(0)
b = groups.get_group(1)
return t_test_verbose(a, sample2=b, fn=stats.ttest_ind) #t-
{'p-': 0.12756432502462475,
' ': 17.761382349686098,
' ': (76.00263198799597, 99.89877646270826),
'n1 ': 284,
'n2 ': 16,
' x ': 87.95070422535211,
' y ': 122.0,
' x ': 10463.941024237296,
' y ': 6669.866666666667,
't-': -1.5985205593851322}
t- t_test_verbose
p-. P- 2 , . , , , , stats t-, t- , , . , , .
t-
t- , , . , , , sciy stats.ttest_1samp
.
. , , - , 90 ., :
def ex_2_18():
groups = load_data('new-site.tsv').groupby('site')['dwell-time']
b = groups.get_group(1)
return t_test_verbose(b, mean=90, fn=stats.ttest_1samp)
{'p- ': 0.13789520958229415,
' df ': 15.0,
' ': (78.4815276659039, 165.5184723340961),
'n1 ': 16,
' x ': 122.0,
' x ': 6669.866666666667,
't- ': 1.5672973291495713}
t_test_verbose
p- , . 78.5 165.5 ., , , 90 . . , .
, t- , , , . resampling. , . , , , , , .
, — . , , , , . , . . , .
, , — , ( ) , « », ( , , .).
pandas sample . , .. n
( , ), axis
(, ) replace
( ), False
. , :
def ex_2_19():
'''
'''
groups = load_data('new-site.tsv').groupby('site')['dwell-time']
b = groups.get_group(1)
xs = [b.sample(len(b), replace=True).mean() for _ in range(1000)]
pd.Series(xs).hist(bins=20)
plt.xlabel(' , .')
plt.ylabel('')
plt.show()
:

, , -. , 16 , ( 78 165 .), t-.
, , . , , .
-. , , .
, - AcmeContent -. , 19 . -, , 20 -, .
- 19 - . , 5% , 24 .
, -. , 0 - , 1 19 :
def ex_2_20():
df = load_data('multiple-sites.tsv')
return df.groupby('site').aggregate(sp.mean)
:
site |
dwell-time |
0 |
79.851064 |
1 |
106.000000 |
2 |
88.229167 |
3 |
97.479167 |
4 |
94.333333 |
5 |
102.333333 |
6 |
144.192982 |
7 |
123.367347 |
8 |
94.346939 |
9 |
89.820000 |
10 |
129.952381 |
11 |
96.982143 |
12 |
80.950820 |
13 |
90.737705 |
14 |
74.764706 |
15 |
119.347826 |
16 |
86.744186 |
17 |
77.891304 |
18 |
94.814815 |
19 |
89.280702 |
-, , - . - , Python itertools, , :
import itertools
def ex_2_21():
''' - t-
" "'''
groups = load_data('multiple-sites.tsv').groupby('site')
alpha = 0.05
pairs = [list(x) # n k
for x in itertools.combinations(range(len(groups)), 2)]
for pair in pairs:
gr, gr2 = groups.get_group( pair[0] ), groups.get_group( pair[1] )
site_a, site_b = pair[0], pair[1]
a, b = gr['dwell-time'], gr2['dwell-time']
p_val = stats.ttest_ind(a, b, equal_var = False).pvalue
if p_val < alpha:
print(' - %i %i : %f'
% (site_a, site_b, p_val))
. , , , . , , - .
, - — , 90 ., -:
def ex_2_22():
groups = load_data('multiple-sites.tsv').groupby('site')
alpha = 0.05
baseline = groups.get_group(0)['dwell-time']
for site_a in range(1, len(groups)):
a = groups.get_group( site_a )['dwell-time']
p_val = stats.ttest_ind(a, baseline, equal_var = False).pvalue
if p_val < alpha:
print(' %i - : %f'
% (site_a, p_val))
-, :
6 - : 0.005534
10 - 10 : 0.006881
p- ( 1%) , . , . t- 20 α, 0.05. α , . 20- t- , - 20.
, t- . . .
, . — , , 1- . .
— α . , k -, α 0.05, :

1- . ex-2-22
, , α :
def ex_2_23():
''' - t-
(0) '''
groups = load_data('multiple-sites.tsv').groupby('site')
alpha = 0.05 / len(groups)
baseline = groups.get_group(0)['dwell-time']
for site_a in range(1, len(groups)):
a = groups.get_group(site_a)['dwell-time']
p_val = stats.ttest_ind(a, baseline, equal_var = False).pvalue
if p_val < alpha:
print(' %i - : %f'
% (site_a, p_val))
, , - .
— 1- , 2- . , , - .
, №4, , 1- 2- , 20 - .