, , 25 1 2020 (wikipedia).
— .
, Google Colab, Google Colab.
c
, , . , .
( 52, 33, 42 19):
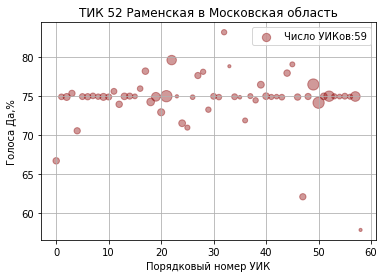

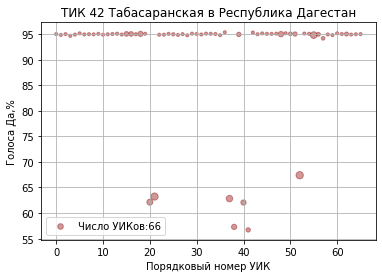


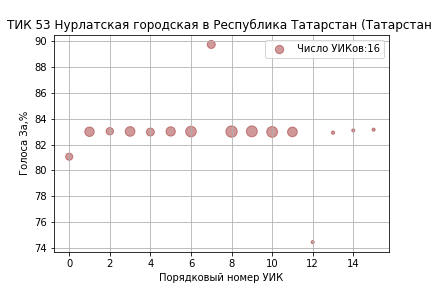


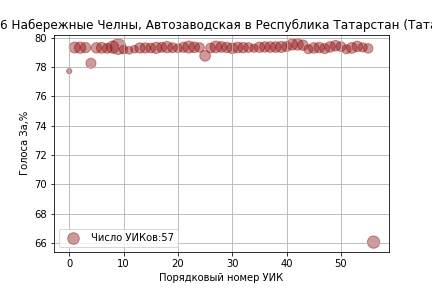
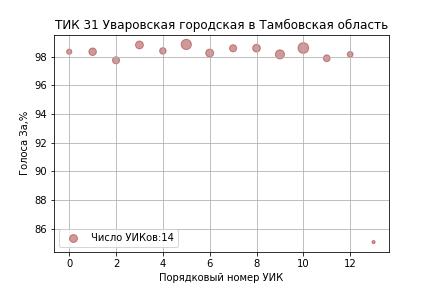


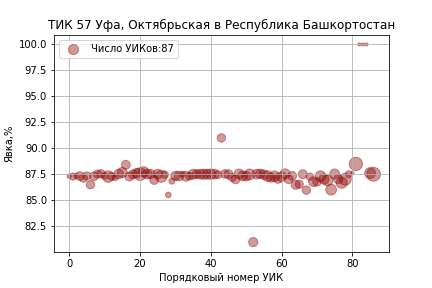
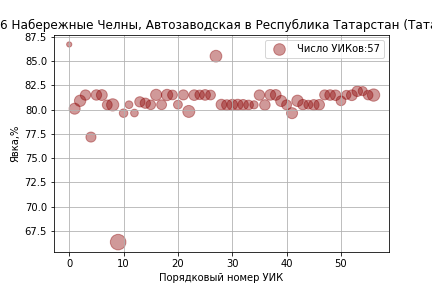
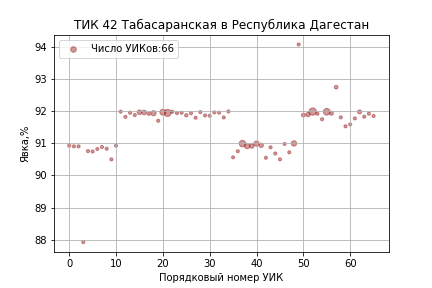


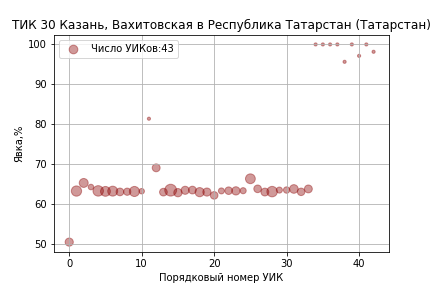
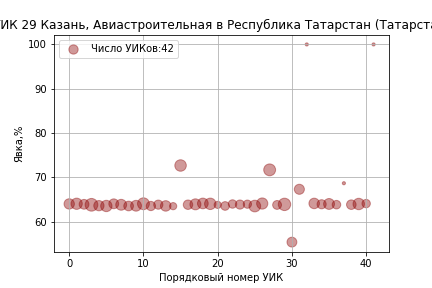

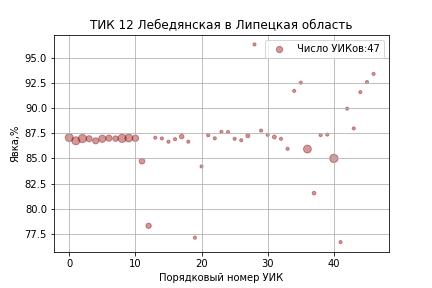
''='', ''=''.
. . , .
JSON CSV . (no data, no job!). , , Telegram- RUElectionData .
- .
- , 10.00 12.00 15.00 18.00 .
- , .
, .
. () youtube.
18 « » . ( ) 12.00 10.00 3%, 15.00 12.00 5% ( ).

, 91%, — 90% ( ).

Runtime->Run All. 15 .
Google Drive Google account. GoogleCredentials . , . .
.
.
( « »). turnouts_05_Jul_2020_14_56.zip results_06_Jul_2020_19_05.zip RUElectionData.
df2 df1 df:
df= pd.merge(df1, df2.drop(columns=['reg']), how='inner',on=['tik', 'uik'])transliterate:
!pip install transliterate
from transliterate import translit
:
df['turnout_pct']=df['n_ballots_all']/df['n_registered_voters']*100.
df['yes_pct']=df['yes']/df['n_ballots_polling_station']*100.
df['no_pct']=df['no']/df['n_ballots_polling_station']*100.
df['invalid_pct']=df['n_ballots_invalid']/df['n_ballots_polling_station']*100.
:
df_original=df.copy(deep=True). « » «» «». 100%.
df=df[df['turnout_pct']<100.]
ax = df.plot.scatter(x='turnout_pct',y='yes_pct',label=' ()',c='DarkBlue',s=0.001)
ax = df.plot.scatter(x='turnout_pct',y='no_pct',label=' ()',c='DarkRed',s=0.001,ax=ax)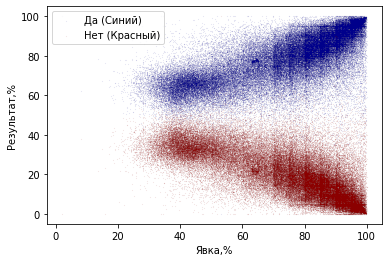
, , «» :
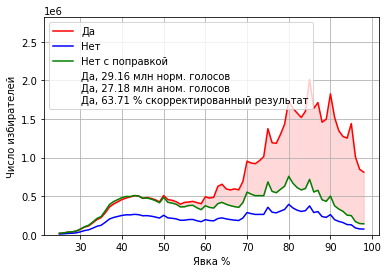
«» :

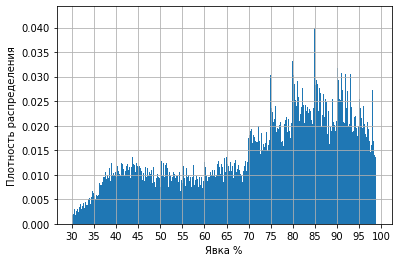
80%, 85%, 90% 95%.
. , , , .
. , ( ) (: A Model Is Only as Good as Its Assumptions).
« » Excel . () wiki:Median absolute deviation.
, «» . , . , 1- 2- . , , url , .
100 ‘’ 153 5570 6 . 5.5 . .
«» . .
. ().
4 , : « ».
« » 50 «»(«»).
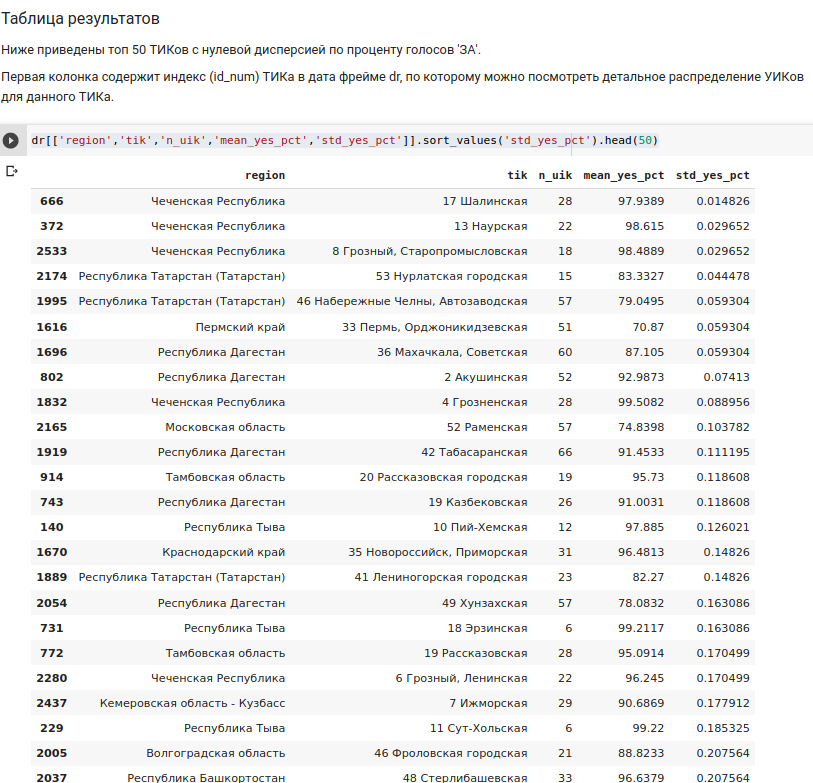
« », . ( ) id_num . id_num 1616, 1995 2165.
id_num=1616 33 ,
( ). :

, «» ( yes_pct) 71.9%. :


, « » «». plot_top_n_results . plot_top_n_results=50 plot_top_n_results=300 .
.
import shutil
from google.colab import files
directory='/content/drive/anomaly/dispersion'
shutil.make_archive(directory, 'zip', directory)
files.download('/content/drive/anomaly/dispersion.zip')
10 . 10 . .
Facebook' .
:
https://elections.dekoder.org/ru/russia/constitution/2020/
https://www.electoral.graphics/ru-ru/
«» https://www.golosinfo.org/.
: https://constitution.observer/
p.s. , . , , . tyomitch Lissov .